Market Watcher |
|
|
Always keeping one eye on the market.
Archives
Important Posts Introducing AIM Introducing X_DEV Introducing Futures Links aim-users.com X_DEV NT AIM Spreadsheet IMGN X_DEV Back Testing Spreadsheet IMGN X_DEV Live PaperTrading Spreadsheet DOW Futures PaperTrading Spreadsheet Email Me |
Friday, May 31, 2002
Thursday, May 30, 2002
SignalWatch: Market Direction - DOW Medium Term Dow In the medium term, we continue to hold Short below 10,060 and will set our stops at 9,950 for Friday's trading session. We will also enter Long at 9,950 tomorrow, with 25 point stops. We will definitely want to stay Short if the market drops below 9,900. Wednesday, May 29, 2002
Good day today, the Futures paper trading account went above $2000 on a end of day basis for the first time. Currently returning about $144 per day. Check out the spreadsheet, I am now trying to take into account slippage on the YM and YJ contracts. In about a month I will go live, first trading YJ, and then YM. SignalWatch: Market Direction - DOW Medium Term Dow In the medium term, we are still Short from 10,060, and will move our stop down to 9,975 - anticipating an upside break at the start of tomorrow's session. We will also go Long above 9,975, with stops at 9,950, and add to Shorts below 9,900. Tuesday, May 28, 2002
SignalWatch: Market Direction - DOW Medium Term Dow In the medium term, we entered Short in the downside move at 10,060 Friday, and will hold our stop at the 10,000 fulcrum level. This is a tight stop, but the 10,000 level is so key to this market that we will want to be out if it is crossed to the upside. We do suggest that new, medium term Longs wait for a break of 10,020 or enter above 10,000 if you can watch the market during the day and exit on a downside crossing back through. In that case, observe the Higher High Rule. The point is, 10,000 is an important level and you will want to be in the market, regardless of which way we move away from it. Monday, May 27, 2002
SignalWatch: Market Direction - DOW We will watch the wide trading range that has formed from 10,060 to 10,225. We closed Longs this morning for a breakeven trade, we also took a 25 point loss on a Short position. Watch 10,060 down, and 10,140 up for Tuesday if you can watch the market. Friday, May 24, 2002
Closing Bell Stopped out at 10125. I read today that when you go from paper trading to real trading, that your losses will double and your profits will halve. With that in mind, I am adjusting the stop loss rules with more of a slant towards capital preservation. After entering a trade with a 25 point stop, the stop will continue to move up until 5 pts better then break even. ie todays trade got to 10084 before reversing on me, so when it hit 10095, the stop would be moved to 10120, at 10090, 10115 and at 10085 stop at 10110. This would have lowered the loss from $125 to $50. I probably won't have time to update here the different stop levels. Thursday, May 23, 2002
Now you tell me SignalWatch: Market Direction - DOW Medium Term Dow Apparently today should have been much better for the Dow trading for me. I shouldn't have entered the trade at 10175 because it was in the first 30 mins, and that second trade was just idiotic. I have a well defined system, and sometimes have no position is a position... its all about capital preservation... I need to sit on my hands sometimes! So on a day I should have been up $125, I was actually down $50. Tomorrow's another day. Closing Bell We are officially out of money for IMGN now. Lets watch X_Dev do its magic. Futures trading today was sort of a bust, it would have been flat if I hadn't taken that spur of the moment short. Currently long from 10187. Wednesday, May 22, 2002
SignalWatch: Market Direction - DOW For tomorrow, we will go Long above 10,175, and Short below 10,060, with 25 point stops. Stopped out at 10085... didn't get a chance to post but 10080 was a significant downtrend level that has been broken. Will reshort at 10065 if it gets there. Tuesday, May 21, 2002
SignalWatch: Market Direction - DOW Medium Term Dow In the medium term, we covered our Short this morning at 10,275 for a breakeven trade, but later re-entered Short at 10,200. We will move our stop up to 10,150 for tomorrow's market. Further moves below 10,100 would imply more weakness. Investors who cannot watch the market closely should wait for an upside break of resistance at 10,220, with a 25 point stop. Closing Bell Good day today, still short from 10230. Up $405 from friday's close and up almost $2000 since may 8. IMGN X_DEV: buy signal today at close. Purchased 609 more shares at $4.99. Currently down 25% vs buy and hold at -35%. Short at 10230. This is a pretty clear pennant formation that has broken down. Stops at 10230. Flags and Pennants are short-term continuation patterns that mark a small consolidation before the previous move resumes. These patterns are usually preceded by a sharp advance or decline with heavy volume, and mark a mid-point of the move.
Good Morning Stopped out at 10275. Set trigger to reload short if goes below gap (in futures) at 10250. Currently short from 10250. Stops at 10250. Monday, May 20, 2002
Medium Term Dow In the medium term, we entered Short on the downside break of 10,275 and are still Short this level. We will move our stop down to our entry for tomorrow. For medium term Longs, we will wait for a break of the upper boundary of the trading range before taking positions. Watch 10,350 up, with a 25 point stop. We will add to Shorts below 10,200. Short Didn't get a chance to update in near realtime... this is what happened so far today: 9:40 am est 11:05 am est: Saturday, May 18, 2002
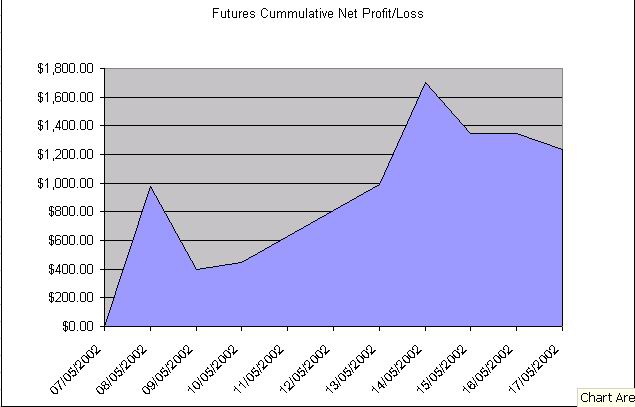
SignalWatch: Market Direction - DOW Medium Term Dow In the medium term, we entered Long this morning on the strong push up through 10,300. We later closed our position on a downside reversal for a 25 point loss, and are presently out of the market. For Monday, watch 10,350 up, and 10,275 down, with 25 point stops. Use the Higher High/ Lower Low and 30 Minute Rules (!). The Close No more trades were done yesterday in the simulations. The chart below shows the net profit/loss versus time of trading 1 YM contract since May 8.
Friday, May 17, 2002
Thursday, May 16, 2002
Wait for it... SignalWatch: Market Direction - DOW We got more sideways action from the Dow today, as it continued to trade within the trading range boundaries mentioned in yesterday's commentary. Looking at the 15 Minute Chart, you can see that the index is "winding up for the pitch." The wide trading range that has formed at the high is now tightening to a point at the right side of the chart, which indicates that a powerful move is coming. We will watch 10,250 for a downside break tomorrow, and will also watch 10,300 up for a break. Since the index has consolidated in such a tight range for three days now, the odds are good for a strong move in the direction of the break. Whenever this happens, we want to be "in" no matter what. So, we will establish our positions so that we re-enter any stopped out positions at the Higher High or Lower Low, holding tight stops after any re-entries that may occur. We will also want to observe the 30 Minute rule carefully. In the medium term, we are still out of the market. For tomorrow, we will enter Short below 10,250, and will go Long above 10,300, with 25 point stops. If we are stopped out, we will re-enter using the Higher High/ Lower Low Rule. (!) Good Triumphs Over Evil Interactive Brokers,direct access trading of stocks,options and futures Any Canadians out there know how expensive and sucky the service from our home grown discount brokers is. After months of dragging their feet, most likely due to pressure from the Big 5 banks in Canada, the regulators finally granted approval to IB to take on Canadian clients. Every canadian trader should have an account in the US. Now, thanks to IB you can! Interactive Brokers Canada Inc. To Begin Accepting On May 14, 2002, the Investments Dealers Association of Canada admitted Interactive Brokers Canada. to its membership. Beginning June 1, Canadian investors who are residents of Alberta, British Columbia, Ontario, or Quebec will have the opportunity to trade US stocks, US equity options and commodity futures and futures options traded on electronic exchanges around the world. It is expected that residents of Manitoba, New Brunswick, Newfoundland, Nova Scotia Prince Edward Island, and Saskatchewan will be able to open accounts with Interactive Brokers Canada in the near future. Canadian stocks and derivatives are not currently available, but the firm plans to eventually offer these products. At this time, Canadian customers must fund their accounts in US dollars. Interactive Brokers Canada's retail commission schedule is as follows: Stocks are $0.01 US per share with a $1.00 US minimum, (after 500 shares in the same order the cost drops to $0.005 US per share), options are $1.00 US per contract and futures are $2.40 US per contract. Interactive Brokers Canada, a global electronic brokerage firm and member of the Interactive Brokers Group LLC (IBG), will provide execution and clearing services for stock, options, futures, currencies and VWAPs. IBG is comprised of electronic brokerage and proprietary trading firms, including Timber Hill, a leading market maker. IBG executes trades on more than 40 exchanges and ECNs in 16 countries. Customers may route their orders to a particular market center, or use the firm's intelligent high-speed Best Execution order routing system. IBG's total consolidated capital as of year-end 2001 was $931.7 million, placing IBG number 31 out of 100 on Institutional Investor's ranking of largest Wall Street firms. IBG's daily trading volume regularly exceeds 200,000 trades. The Group employs approximately 430 traders, programmers and support staff located in offices and exchanges throughout the world. Wednesday, May 15, 2002
For Tomorrow SignalWatch: Market Direction - DOW We are now out of the market and will enter Short below 10,225, or go Long above 10,350. Either position with use a 25 point stop. Closing Bell Futures: Sold the contract purchased on monday for 250 points or $1250 gain. Then was stopped out again (twice) for a $125 loss and a $0 loss. Overall lost $355 from yesterdays close. Up $1345 since May 8. IMGN X_Dev: NT AIM. Since its been a month since the last buy for Nortel its time to visit it again. AIM says buy 620 shares at 3.85. I am a little concerned about running out of cash, so I am only adding 400 shares at 3.85. AIM is at -44% where Buy and Hold is at -53%. Its not AIMs fault, Nortel is just a crappy stock. You can't expect to make money going long on a stock that goes straight down and never even rallies more then 10%. Is anybody reading these? Send me an email if you are out there.
Long again at the days high, following the signalwatch.com style of playing this whipsaw days. Long at 10295, with 25point stop loss. Exciting morning... Stopped out at 10250 in the morning... as always we reloaded the buy stop at the days high (looked to the futures here, the high was 10270), now we are long at 10270 with a 25 pt stop. IMGN is roaring and will generate a sell if it stays up at 6.75 Tuesday, May 14, 2002
SignalWatch: Market Direction - DOW In the medium term, we are still Long from 10,000, and will move our stops up to 10,250 for tomorrow, which will lock in 250 points of profit for this move. If you can watch the market during the day, close and go Short below 10,250, with 25 point stops. Otherwise, 10,200 is the best level to be Short for those that cannot watch the market. On this page we will go short below 10200. I prefer to have a buffer zone between going long and going short. Closing Bell IMGN X_Dev continues to buy at this level, picking up another 417 shares at $6.20. X_Dev is at -10% where Buy and hold is at -17%. DOW Futures: Still long the contract from yesterday morning, now looking at a 296 point gain. Check back later for tomorrows instructions. Since May 8th, up $1700 per contract! Things are rocking today. Currently up 253 points. The gap from this morning is itching to be filled. Lets place a protective stop at 10200 just in case. Monday, May 13, 2002
In the medium term, we covered our Short from Friday at 10,000 this morning for a 10 point loss. We also entered Long at 10,000 and are still Long this index. We will move our stop up to 10,045 to lock in some profit on this move, just below support at 10,050. We will also look to go Short below 10,045, with a 25 point stop. Dow Index closed at 10109, giving us a net profit today of $495 Date opened Date Closed Position Open/Closed Enter Price Exit Price Difference Return IMGN continues to slide giving us a buy signal to pick up 510 more shares. X_DEV is at -9.6%, while buy and hold is -17%. The goal here is to beat the performance of buy and hold, or in the case of a loser like IMGN, the goal is to break even. NT buy coming Wednesday at close. Interview with a Stock Market Interview With the Nasdaq By John Roque I'm presenting a conversation I had yesterday with the Nasdaq. In the tradition of ESPN "Sunday Night," my encounter with the Nasdaq was a Mother's Day mix of bravado, bleeps and machismo as the Nasdaq waxed ineloquently about stuff from its legacy thus far to its history still to be written. Interviewer: Readers are interested in hearing your take. Let's get started. Nasdaq: Make it quick. I've got a big night planned, and I don't want this to stop me from spending some green. I sold Emulex (EMLX:Nasdaq - news - commentary - research - analysis) Friday, and though I'm a little light on the benjamins, they're ready to be spent. It's time I talk about myself. Interviewer: You've been bearish for a long time. Can we ever expect that you'll be back at full strength? Nasdaq: Yeah, I'll be back. I'm Nasdaq. I was the baddest stock index on the planet for a long time. People jumped on my coattails and rode me to fortunes. Why shouldn't I come back? Interviewer: Some investors say you're overvalued while others say you're bearish technically. Nasdaq: Overvalued? Man, I've always been overvalued. But that overvaluation thing is a joke. Where were they on the overvaluation issue when I was making them a ton of coin? When Qualcomm (QCOM:Nasdaq - news - commentary - research - analysis) went to the moon and Human Genome Sciences (HGSI:Nasdaq - news - commentary - research - analysis) was going to save the world? You buy Nasdaq stocks because you have a dream. If you can dream, stick with me and those Wall Street strategists with overweight tech allocations. They're part of my dream network. Those guys and Dionne Warwick. Interviewer: How about the bearish technical signals? My favorite technical team, the guys at Arnhold & S. Bleichroeder, wrote that market declines are more debilitating than market advances are soothing, as more than one-third of the time this year you've had downside volume greater than or equal to 70% of total volume. A lot of stocks, and you too, are below downward-sloping 50- and 200-day moving averages, and you're not oversold based on their 50-day spread indicator. And in their reports a month ago, they wrote that semiconductor stocks were ready to weaken sharply. While the stocks are down a lot since, they look like they have more room to fall. Nasdaq: The technical guys at Arnhold & S. Bleichroeder? Sometimes they're funny, but they're small potatoes. Besides, if they're so good, why aren't they at a big shop? I ain't giving any of my publicity to anyone that ain't bullish like me. They're not part of my dream network and won't be. The only thing they're dreaming about is making it to the big leagues. So what if what they say is true? It won't matter because I'm Nasdaq, and people remember what happens when I rally. So forget the technical stuff. You've got to buy Nasdaq stocks because I roar when the market rallies. Don't you remember last Wednesday? I was up almost 8%. Interviewer: That was interesting. Nasdaq: It was better than interesting. It was frightening. It frightened investors who didn't have enough tech, and it frightened hedgies who had sold tech short. They're all afraid of me because they can't bear to not have enough tech if they're long investors and too much tech if they're short. I'm the biggest enigma wrapped in a riddle since Russia. I'm Dr. Jekyll and Mr. Hyde. I'm the Rock, Hollywood Hulk Hogan and Stone Cold Steve Austin wrapped in one. Look up hyperbole, and a photo of the Nasdaq market is there. I'm still a huge part of the benchmarks. And as they all say, "I've got to be there in case Nasdaq rallies." Besides, what are people gonna buy? Small-cap gold and silver stocks? Ha! Air Products (APD:NYSE - news - commentary - research - analysis)? That ain't dreamin'. That's snoozin'. Interviewer: You were up 8% last Wednesday, have given back almost 6%, and have filled the gap. A&SB says -- Nasdaq: Those cats again? Interviewer: Well, they had a chart last week that detailed your decline since March 2000, and it looks eerily like that of the Dow Jones Industrial Average from 1929 to 1932. During that time, the Dow had six failing rallies and you've had four. Their contention is that if you make a new low below last Tuesday's low (1560), the next move down will be sharp and serious and result in a target near 1294. Each new low in the Dow from 1929 to 1932 resulted in an average decline of 23.7%, and each new low of yours has resulted in a move 23% lower. So if history is any guide, their target of 1294 might be a little light. Related Stories Nasdaq: What is it with you and those A&SB guys? Listen, I'll be fine. Besides, I've been going down for two years. I can't go down much more. Interviewer: On the contrary, A&SB shows that after the oil service sector bubble popped in '81, it fell for five years and has been, except for brief rallies, declining relatively since the 1981 peak. Of course, you know about Japan and the Dow from 1929 to 1932. Nasdaq: Look, I'm only gonna say this once because the limo is idling, I'm mad, and this interview is over. I'm about driving looking through the windshield, not the rearview mirror. Don't burden me with ancient history. I'm not about history; I am about the future. I'm about technology and biotechnology and telecommunications. That's the future. If people have lost a fortune, their life savings, their retirement nest eggs and the college funds for their children, well, sometimes on the road to El Dorado there are casualties. I'll be back. Look into my eyes and believe. Drink the Kool-Aid with me. Postscript I smiled back at Nasdaq without answering, knowing that Kool-Aid is for kids and McDonald's is going to rally. Sunday, May 12, 2002
DOW: We will use 10,000 as our stop for Monday. Consider Longs above this level, with 25 point stops. Friday, May 10, 2002
Days Summary: IMGN plunged, we scooped up 395 shares at the close. X_Dev is at -6.2% were buy and hold is at -11.75%. Futures: We entered short at 10000 only to get stopped out. We reshorted at 9990, and are still in that position. Check back on sunday for new instructions. 10/05/2002 10/05/2002 -1 C 10000 10025 25 -$125.00
Thursday, May 09, 2002
DOW Instructions for tomorrow: For tomorrow, we will enter Long above 10,075, and Short below 10,000, with 25 point stops. Daily Summary: Futures: Now flat. Stopped out with a gain of $395. Date opened Date Closed Position Open/Closed Enter Price Exit Price Difference Return IMGN X_Dev: No change NT X_Dev: No change Wednesday, May 08, 2002
DOW Instructions: We will hold our stop at Tomorrow hopefully will be consolidation at the high. Awesome day for the simulations: IMGN X_Dev: Sold 192 shares at the closing price of $7.99. Current return stands at 4.5% vs Buy and Hold at 6.7% DOW E-Mini: Well the first day of the simulation was awesome. Went long at the open this morning and are still long, with the Dow closing at the high of day. Date Position Open/Closed Enter PriceExit Price Difference Return Lunch time update. Futures: Currently up almost 150 points. Raising stop to 10080, below an obvious support level on the 1 minute daily chart. If stopped out, will reenter if the dow trades above 10140. IMGN X_DEV: If IMGN stays up in the 7.80 area, we will be getting a sell at close signal. NT AIM: NT is still in the buy zone, but we must wait until the 30 day rule expires next wednesday. Purchase 1 DOW futures contract, 9946. The index opened lower, but the futures already were up around 9950. 25 point stop. If stopped out, we re-enter at just above the high of day. DOW futures have exploded this morning... thanks to the homerun quarter by Cisco. DOW futures currently up 155 points. We are taking a position at the open. Tuesday, May 07, 2002
Lets Do This Ok, as of right now, I am launching the futures simulation. First some background. If you want to learn about what a future contract is check this out: How much money is required to trade a futures contract. Well for the simulation we are going to look at YM, which is the Mini-Sized Dow Jones $5 multiplier contract, which requires a margin of about $2000. The $5 Dow Jones contract, means that for each point the Dow changes, the value of your contract changes by $5. So for about $2000, you can receive the gains or losses of a $50 000 investment in the Dow. ie if you are long 1 contract, and the DOW goes up 200 points, you will receive $1000. If you are long 1 contract, and the DOW goes down 200 points, $1000 will be removed from your account. For this simulation, we will trade 1 contract. We will assume that the Dow cash index is the price of the futures. (This is not exactly true, but will be ok for the simulation, as the futures closely follow the DOW cash index). Trade Rules for Tomorrow Review Signalwatch.com. The instructions are: For tomorrow, we will enter Short below 9,800, with 25 point stops - observing the 30 Minute Rule. If you can watch the market during the day, go Long above 9,900, with 25 point stops. 30 MINUTE RULE: Do not trade gaps at the Open, in the direction of the prior day's trend. If the market gained the day before, and gaps up within the first 30 minutes, you should wait for the pent-up demand (exhaustion move) to bleed off. Otherwise, you can easily get caught in a fading market. After the opening gap, if the market continues up (or down) an entry there is O.K., with stops at the point of the gap. Note that the Dow never actually gaps, as it takes a while to get all the symbols open. Gaps on the OEX or SPX can be used as surrogates for the Dow. You have to look at the DIA symbol, or the NASDAQ to determine if demand to buy or sell is outstripping supply at the Open. Also, small gaps don't count. There needs to be a large enough gap to indicate a strong imbalance. On the Dow, this would be in the neighborhood of 50-100 points. HIGHER HIGH RULE: When we establish a fulcrum, watch for higher highs or lower lows around the level, and do not enter again in a move away from the fulcrum unless the recent highest high or lowest low has been broken. By doing this, we are able to avoid multiple whipsaws -- UNLESS there is an expanding triangle - a rare occurrence. Check back tomorrow for the results! Download the spreadsheet and play along. Monday, May 06, 2002
The Futures is Friendly Eventually, I will have a futures daytrading simulation. It will be based on Signalwatch.com analysis on the market. Book mark this page and check it daily, to get a background on how I am going to trade the Dow. Sunday, May 05, 2002
The IMGN X_Dev Experiment I have started simulating the X_Dev trading system using IMGN. Using a portfolio of $30 000, the simulation started on April 29, at a price of $7.49. X_Dev signaled this price as an X_Dev buy, so to kick start the system, I have bought $20000 (2670 shares) at that price. On April 30th, the stock rose to $8.24, and X_Dev sold 60 shares. On May 3rd, X_Dev sold 90 more shares at $8.00. Currently X_Dev is at 4.6% return versus 6.8% for buy and hold. Don't worry, X_Dev will catch up and surpass b&h. Play along. Download my spreadsheet that is tracking the IMGN X_Dev experiment. Looking for More Action - X_DEV AIM is great for longer term, retirement type funds. It generates on average 4 trades per year. But if you are looking to be a more aggressive investor, X_DEV may be for you. X_DEV is the creation of Myst, over at StockWerld.com. X_DEV is another East-West system, ie it has a stock portion, and a cash reserve. Back testing has shown that X_DEV always beats AIM (after a few cycles), at the cost of many more transactions. An X_DEV system, optimized properly for a volatile stock will generate dozens of transactions a year. It took me awhile to understand how X_DEV works, reading Mysts page left me with a lot of questions. But basically the system is measuring the deviation of the current price from a short term moving average. If it goes too far from the moving average, then the system buys or sells a portion of the portfolio. For example, if the system is set to buy if the price is more then 6% from the SMA, and the stock falls 15%, you would use 15% of your portfolio's value to buy stock. I am going to simulate an X_DEV system here using IMGN as the stock. I have back tested the system for 5 months, getting my first buy on Dec 12, when the stock was $15.09. 37 trades later, X_Dev is basically at 0%, but the stock has fallen 46%! This chart shows the backtest for IMGN.
Here is the performance of buy and hold vs X_Dev as time went on.
As you can see in this chart, as time goes on X_Dev steadily increases in performance relative to buy and hold.
And finally here you can see the percent deviation of IMGN from its 5 day SMA. Currently I have the system set to buy at <= 0.94 or >=1.01.
Saturday, May 04, 2002
Trading Systems During this whole market meltdown, I have been researching different trading systems, trying to find the perfect system for me. I am looking at three systems, Automatic Investment Management, Extreme Price Deviation, and Ed Downs Signalwatch.com dow signals applied to the Dow e-mini futures. I am currently simulating some of these, and plan to simulate all three, posting any trades and giving monthly updates to portfolios. Today I'll bring you up to speed on AIM. Automatic Investment Management - AIM About four months ago I came across a message board posting talking about a book "How to Make $1 000 000 in the Stock Market Automatically" by Robert Lichello. I picked up the book at my local Chapters for $10 CDN. The author describes a period in the 1970s, when stocks basically went nowhere over 8 years. Sure they went up, and they went down, but they didn't make any real headway for a long time. The buy and hold investor broke even at best.
We can make the argument that we are now in a time where stocks will just chop around for years, while the E catches up the P in P/Es, the technology infrastructure that was overbuilt finally becomes oversubscribed, and while investor confidence returns from the damage caused by scandals such as Enron. For more info on this see: 'Locust Cycle' May Bug Street for Years. So if the buy and hold investor is not going to work, we must trade stocks, selling at the high, and buying at the low. But how do we do this? Conventional TA doesn't seem to work that well, as traders are dropping like flies. Instead of using predictive TA, we can use reactive TA. Reactive TA only responds to past events, and makes no bets on the future price. Therefore you are always right, because you expect the stock to go either up or down! Lichello's Automatic Investment Management system (AIM), provides a formula for calculating what actions you should take based on the current value of your stock, the amount of cash you have in your AIM account and the previous investment actions you have taken. Basically AIM tries to strike a balance between your cash and your stock value. If the stock goes down you buy more. If the stock goes up, you sell some to raise more cash. Thats about the best I can do to describe how the system works, but for more information, see Tom Veale's excellent website on AIM. http://www.aim-users.com. I also recommend you pick up the book as Tom's site is more for advanced users. The book provides the necessary background to understand the site. A Real Life Example - Nortel In the book, Lichello found a mutual fund that if you had used AIM on in the 70s, $10K would become $1000K in 10 years. I decided to simulate AIMing Nortel, to get the hang of the system before I went live with my own mutual funds. March 14, 2002 I started the system on March 14, 2002, when Nortel was trading at $8.20 CDN. I started off buying 683 shares, giving us $5600 worth of nortel stock, and $4400 cash. (Cash Reserve is at 44% of Total Portfolio). April 16, 2002 The AIM system is saying to add more nortel stock to Currently the portfolio value is $8327, a -16% return Compare that to nortels stock performance since then New instructions are to sell some at $8.02 or to buy May 4, 2002 Well Nortel has turned into a real turd of a stock, currently -42% since the inital buy. But the AIM system has kept our losses to 25%. The system is begging to buy more, but I am waiting until the end of the 30 days, we don't want to run out of cash if nortel is going to continue to make a deep dive. If you want to follow along, download the spreadsheet from the link on the left.
Friday, May 03, 2002
Thursday, May 02, 2002
Here is what has caught my interest today: Nortel is at a really critical point here. It needs to bounce, and bounce hard, or its going to violate 20 years of support, which isn't going to be good. If it goes under 3, it probably is going to head to book value (around $2), and won't be going above $3 for a very long time.
WIND isn't looking so good. It finally broke through that $10 mark. However I wouldn't be surprised to see it bounce and move up to $10 over the next little while to fill todays gap, but $10 is an obvious resistance level, and sellers will appear there. It will take improving earnings or some other extraordinary event to get back above $10. The longer term wind chart shows it is either at or just broken resistance (depends on how today goes).
|